date: 2019-06-30 19:00
# Node 中的全链路式日志标记及处理
本篇文章开始之前先抛出两个问题:
- 当在客户端捕捉到一条异常请求时,如何有效地排查问题?
- 当在生产环境中发现某条 API 高延迟,又如何定位问题?
从挂下来的蜘蛛丝可以找到蜘蛛的所在,从灶马爬过留下的痕迹可以查出灶马的去向。
而要更有效解决此类问题,我们需要依赖全链路式的日志作为蛛丝马迹。如当发现测试环境某条 API 延迟过高时,通过该 API 在日志系统中找到所涉及到的所有关键逻辑及数据库查询,查找是否 SQL 查询过多或其中有慢查询所致,或者是否被上游服务拖累。
在微服务架构中,标记全链路日志有助于更好的解决 bug 和分析接口性能,本篇文章介绍在 Node 中如何标记全链路式日志
# 当一个请求到来时,服务器端会产生哪些日志
AccessLog: 这是最常见的日志类型,一般在nginx等方向代理中也有日志记录,但在业务系统中有时需要更详细的日志记录,如 API 耗时,详细的 request body 与 response bodySQLLog: 关于数据库查询的日志,记录 SQL、涉及到的 table、以及执行时间,从此可以筛选出执行过慢的SQL,也可以筛选出某条API对应的SQL条数RequestLog: 请求第三方服务产生的日志Exception: 异常RedisLog: 缓存,也有一些非缓存的操作如zset及分布式锁等Message Queue Log: 记录生产消息及消费消息的日志CronLog: 记录定时任务执行的时间以及是否成功- 关键业务逻辑
# 如何标记全链路上所有日志
使用 requestId 唯一标识每个请求,有时它又被称为 sessionId 或者 transactionId,在更多情况下它被称作 traceId
操作步骤如下
- 使用一个中间件获取
requestId,并存储到Context中。中间件通过读取请求头X-Request-Id来获取,如果请求方未设置,则自动生成 - 使
requestId在整个链路进行手动传递,如读取context.requestId,手动注入到ORM进行SQL查询的日志中
// 关于处理 requestId 的 koa middleware
async function context (ctx: KoaContext, next: any) {
  // 从前端获取到 requestId,如果前端没有,则自己生成随机Id
  const requestId = ctx.header['x-request-id'] || uuid()
  // 设置 requestId 的响应头
  ctx.res.setHeader('X-Request-Id', requestId)
  // 存储到 Context 中
  ctx.requestId = requestId
  await next()
}

app.use('/todos/:id', (ctx) => {
  const user = await User.findByPk(ctx.body.id, {
    logging (sql) {
      loger.log(sql, {
        // 从 Context 中获取信息手动传递 requestId
        requestId: ctx.requestId
      })
    }
  })
})
显而易见,这样手动层层传递很繁琐,特别是在崇尚分层的服务器架构中,这样可能需要传递五六层 此时需要以更小侵入性的方式来标记 requestId
# 降低侵入性
如上,在每次数据库查询时手动对 requestId 进行标记过于繁琐,何况除了与数据库交互,还要有诸多微服务进行交互。
此时可以统一设计 logger 函数进行标记,并且使用 CLS (Continues Local Storage) 来管理异步资源中的 requestId。
关于 CLS 的实现,实例中用到了 cls-hooked,它关于异步资源生命周期追踪的原理是 async_hooks。
- 通过 async_hooks (opens new window) 可以追踪异步行为的生命周期
- 通过 cls-hooked (opens new window) 可以获得每次异步请求的 requestId
如下代码中
lib/session.ts: CLS 异步资源存储middleware/session.ts: 关于 requestId 的中间件,从客户端获取 requestId,并存入 CLS 中lib/logger.ts: 全局 logger,通过 CLS 注入 requestId,可参考上一章 如何在 Node 中高效地打日志 (opens new window)
// lib/session.ts
import { createNamespace } from 'cls-hooked'

const session = createNamespace('hello, world')

export { session }

// middleware/session.ts
function session (ctx: KoaContext, next: any) {
  await session.runPromise(() => {
    // 获取 requestId
    const requestId = ctx.header['x-request-id'] || uuid()
    ctx.res.setHeader('X-Request-ID', requestId)
    // CLS 中设置 requestId
    session.set('requestId', requestId)
    return next()
  })
}

// lib/logger.ts
import winston, { format } from 'winston'

const requestId = format((info) => {
  // 每次自动获取 requestId
  info.requestId = session.get('requestId')
  return info
})

const logger = winston.createLogger({
  format: format.combine(
    requestId(),
    format.json()
  )
})
如果你使用过 zipkin,一款全链路式日志分析工具的话,它其中也是用了 CLS
const zipkin = require('zipkin');

// In Node.js, the recommended context API to use is zipkin-context-cls.
const CLSContext = require('zipkin-context-cls');
const ctxImpl = new CLSContext(); // if you want to use CLS
const xtxImpl = new zipkin.ExplicitContext(); // Alternative; if you want to pass around the context manually

// Tracer will be a one to many relationship with instrumentation that use it (like express)
const tracer = new zipkin.Tracer({
  ctxImpl, // the in-process context
  recorder: new zipkin.ConsoleRecorder(), // For easy debugging. You probably want to use an actual implementation, like Kafka or AWS SQS.
  sampler: new zipkin.sampler.CountingSampler(0.01), // sample rate 0.01 will sample 1 % of all incoming requests
  traceId128Bit: true, // to generate 128-bit trace IDs. 64-bit (false) is default
  localServiceName: 'my-service' // indicates this node in your service graph
});
关于 async_hooks 及 CLS 的实现可参考下一章节
# 如何从全链路日志中得益
- 当
sentry(警报系统) 中收到一条异常警报时,通过requestId可以在elk(日志系统) 中获取到关于该异常的所有关键日志 (sql, redis, 关键函数的输入输出) - 当客户端一条请求过慢时,通过请求头获取到的
requestId可以在elk中分析该请求的所有数据库查询时间,请求响应时间,缓存是否命中等指标 - 查找 API 对应执行的 SQL 语句以及条数,判断是否有冗余 SQL 语句的查询
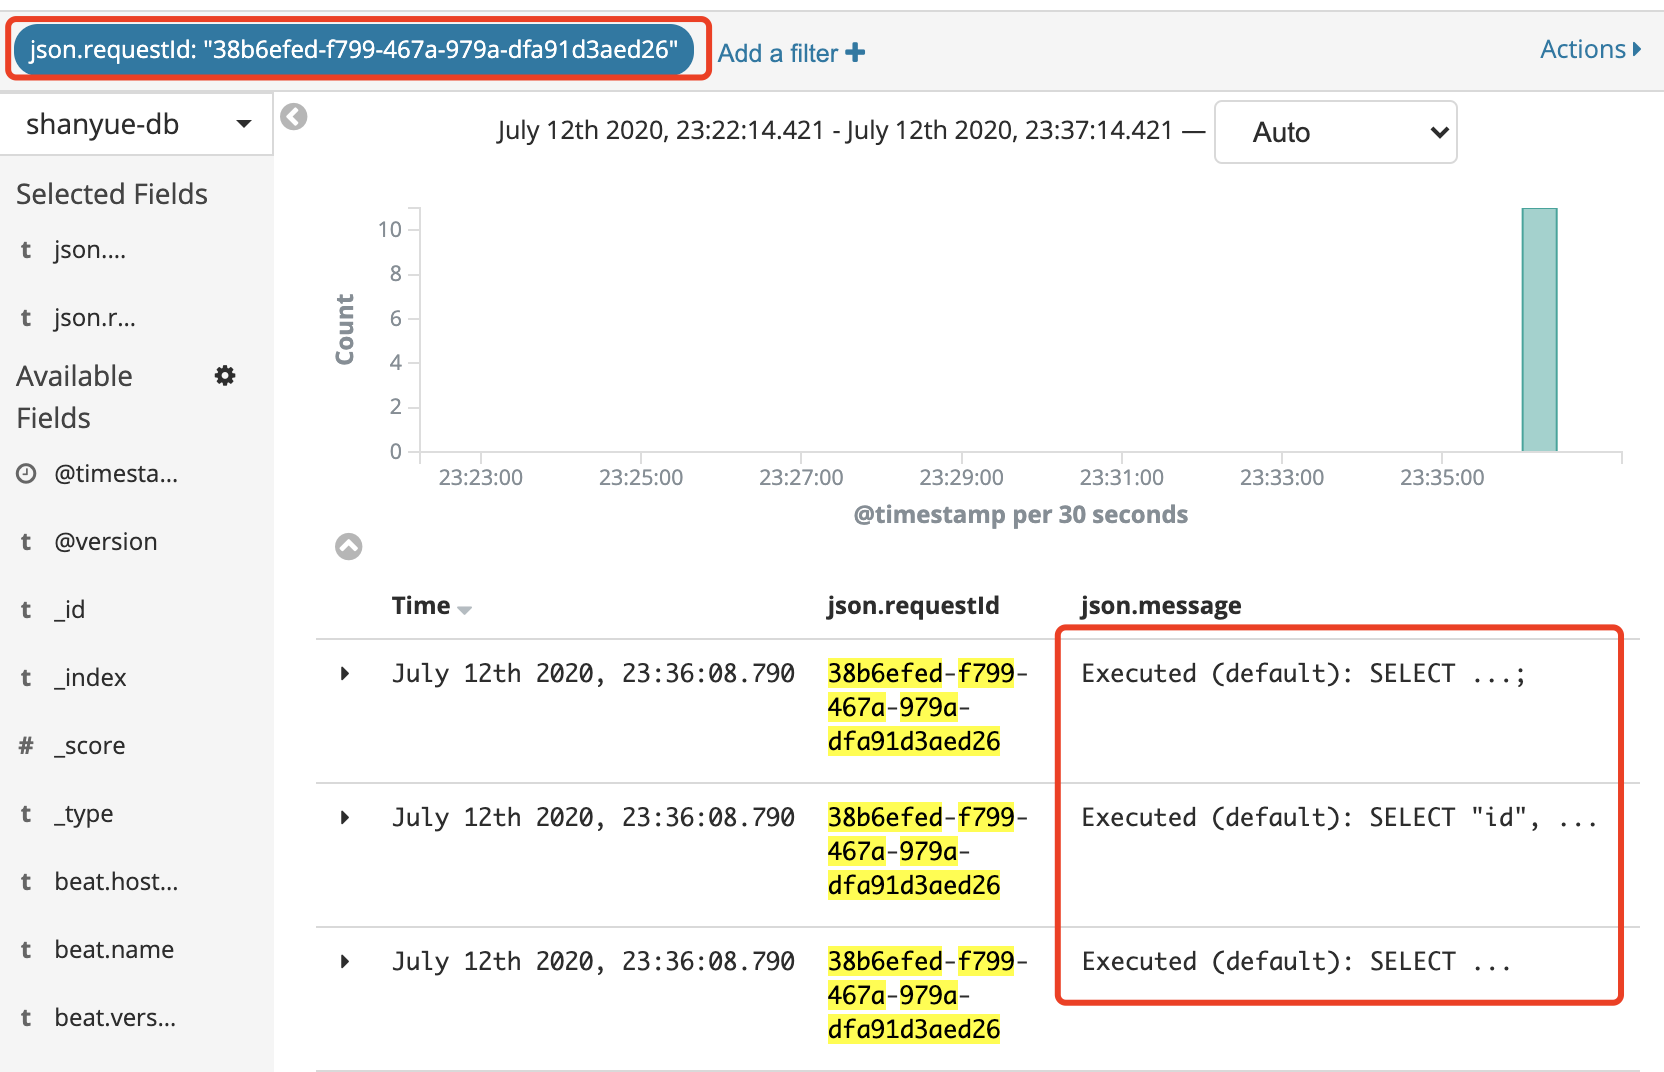
如下图,通过 requestId 涉及到的数据库查询的日志 (关于真实 SQL 做了隐藏处理)
# 从全链路分析各阶段耗时
以上只是完善了全链路式日志,如果要查看全链路各个阶段的耗时如何做?
此时就需要接入全链路式分析平台,如
- zipkin (opens new window): Zipkin is a distributed tracing system. It helps gather timing data needed to troubleshoot latency problems in service architectures. Features include both the collection and lookup of this data.
- jaeger (opens new window): open source, end-to-end distributed tracing
下一章讲解如何接入 zikin 及相关代码与操作